

Best Grading Tools for Handling Class Average Analytics 2026
A Friendly Guide for Teachers
As a teacher, tracking class performance isn’t just about assigning grades — it’s about understanding trends, spotting who might be struggling,Quick Grade and planning your next steps. That’s where grading tools with class average analytics come in. They help you go beyond numbers and give meaningful insights into student learning without extra work.
In this guide, we’ll explore some of the best tools that make grading easier and give you useful analytics you can act on today.
Why Analytics Matter in Grading
Class average analytics help you:
- See overall student performance at a glance
- Identify patterns like high or low scores on specific assignments
- Catch when a concept might need reteaching
- Track progress over time
Instead of manually calculating averages and making graphs, smart grading tools do it for you. They make your grading faster and more informative.
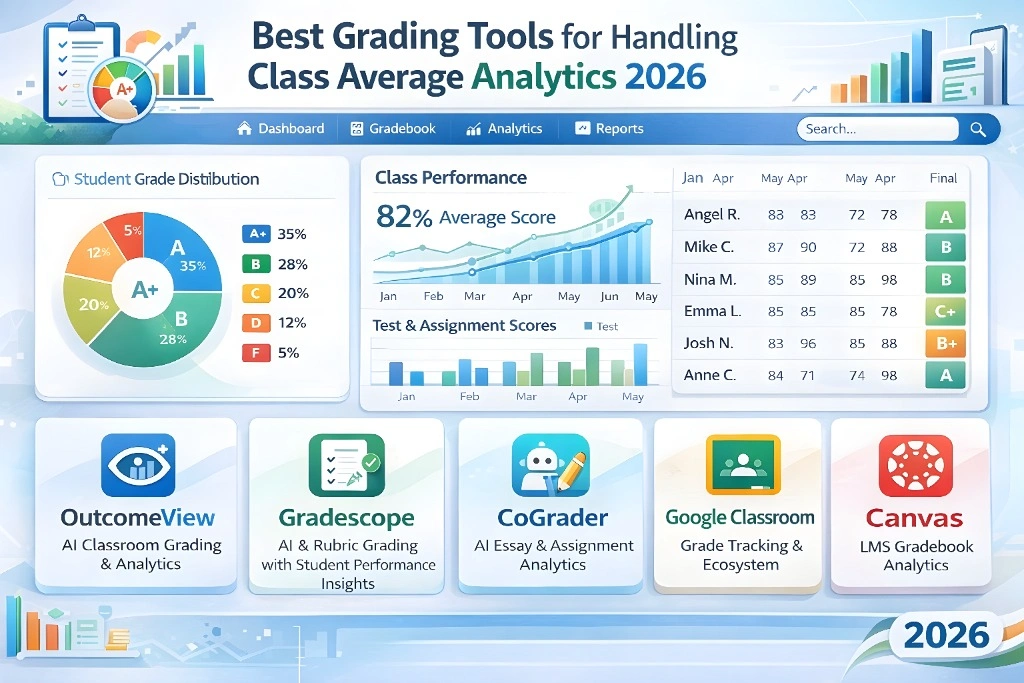
Top Grading Tools With Class Average Analytics
1. Gradescope
Best for mixed assignment types
Gradescope is widely used in K‑12 and higher education for grading everything from quizzes to essays. It uses rubrics to speed up grading and can cluster similar student responses so you don’t have to grade each one separately. The analytics dashboard shows class performance trends and averages, helping you spot trouble spots quickly.
Why Teachers Like It: Simple grading interface + visual analytics = faster insights.
Tip: Use Gradescope to compare class averages over time to track improvement or gaps.
2. CoGrader
Great for class performance insights
CoGrader doesn’t just score assignments — it also gives detailed analytics on how the class is doing as a whole. You can see averages, trends, and areas where students struggled most. It even integrates with tools like Google Classroom, making it easy to pull scores and reports.
Tip: Share performance summaries with students to help them understand how their class as a whole is doing.You can also read: How to Grade Multiple-Choice Tests with a Calculator
3. Learning Analytics in LMS Platforms (like Google Classroom & Canvas)
Built‑in, no extra software needed
Platforms like Google Classroom and Canvas offer grading plus analytics dashboards that show things like class averages, assignment completion rates, and how engaged students are. These systems are already part of many schools, so you don’t need anything new to get started.
Why This Works: No learning curve — you already use these platforms for assignments.
Tip: Look at “class insights” or “score summaries” after every major assignment to track trends.
4. Schoolytics (Student Data Platform)
Holistic analytics beyond just grades
Schoolytics is designed to help educators track trends and monitor student outcomes across grades and activities. It combines assessment results with analytics, making it easier to reflect on classroom performance overall and adjust your approach.
Tip: Use performance patterns from Schoolytics to inform targeted review sessions.
5. General Analytics Tools (Sheets, Power BI, Tableau)
For deeper, custom insights
If you like working with your own data, tools like Google Sheets, Microsoft Excel, Power BI, or Tableau let you import class grades and create visual reports and dashboards. These aren’t specific grading tools, but they give you full control over how you analyze class averages and trends.
Tip: Export grades from your LMS or grading tool and build a simple dashboard to track averages by assignment or over time.
Tips for Getting the Most From Grade Analytics
1. Look at Trends — Not Just One Average
A single class average doesn’t tell the whole story. Compare averages over multiple assignments to spot patterns.
2. Use Analytics to Drive Instruction
If several students struggle with the same question or topic, analytics can highlight that, so you know what to reteach.
3. Share Analytics With Students
Showing students where the class stands and where they’re headed can boost motivation and help them take charge of their learning.
(FAQs)
1. What is class average analytics?
Class average analytics refers to tools that calculate and visualize how the class performs overall on assignments or tests, helping you see trends over time instead of just individual scores.
2. Do these tools work for small classes too?
Yes! Even with smaller groups, analytics help you understand learning gaps and tailor instruction.
3. Can I use these tools without tech experience?
Absolutely. Tools like Google Classroom and Canvas include built‑in analytics that are easy to read and interpret.
4. Are analytics tools free?
Many platforms include analytics for free, especially if your school already uses them. Some advanced tools may require payment.
5. How often should I check class averages?
Check after every major assignment or test. Monthly summaries also help you spot long‑term trends.
Final Thoughts
Grading doesn’t have to be just about lists of numbers. Grading tools with analytics turn your scores into insights that can improve your teaching and student learning. Whether you use built‑in LMS dashboards, automated grading platforms, or data visualization tools, understanding class averages helps you teach smarter, not harder.
Keep your workflow simple, use the insights regularly, and you’ll be surprised how much easier managing class performance becomes.


