
How to Use a Grading Chart the Smart Way (Simple Guide)
If you’ve ever looked at a pile of tests and thought, “There has to be an easier way,” — you’re right. A grading chart can save you time, reduce mistakes,Quick Grade and make your grading more fair.
In this guide, I’ll show you how to use a grading chart the smart way, even if you’re a beginner.
What Is a Grading Chart?
A grading chart is a simple table that shows how raw scores (like 18 out of 20) turn into percentages or grades (like 90% or A).
Instead of calculating each score again and again, you just look at the chart and get your answer instantly.You can also read: Easy Grader for Math Tests with Half Points A Simple Solution
Example:
| Correct Answers | Percentage | Grade |
|---|---|---|
| 18/20 | 90% | A |
| 16/20 | 80% | B |
| 14/20 | 70% | C |
Simple, right?
Why Use a Grading Chart?
Here’s why teachers and students love it:
1. Saves Time
No more calculating every single paper manually.
2. Reduces Mistakes
Math errors happen when you’re tired. Charts fix that.
3. Keeps Grading Fair
Every student is graded using the same system.
4. Easy to Understand
Students can quickly see how their score turns into a grade.
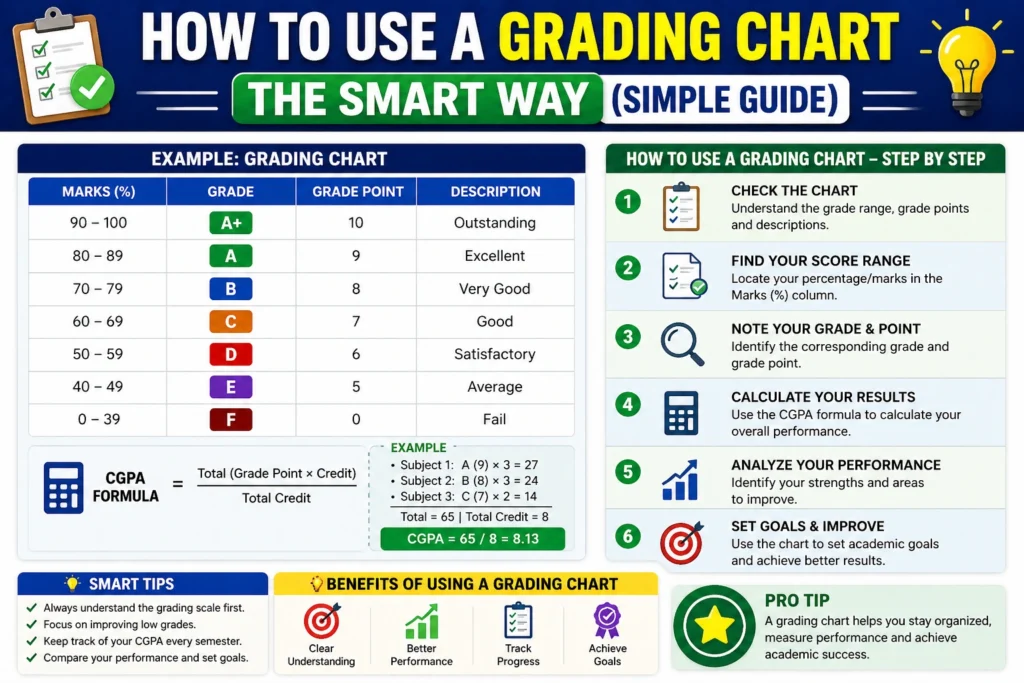
How to Use a Grading Chart (Step-by-Step)
Let’s keep it super simple.
Step 1: Know Total Questions
Start with how many questions are on the test.
Example: 25 questions
Step2: Count Correct Answers
Check how many answers the student got right.
Example: 20 correct
Step 3: Find It in the Chart
Look at your grading chart and match:
20 out of 25 → 80%
Step 4: Assign the Grade
Use your grading scale:
80% → B grade
Done in seconds.
Smart Tips to Use a Grading Chart Better
Want to level up? Try these tips:
Use Pre-Made Charts
You don’t need to create one every time. Keep a ready chart for common test sizes (10, 20, 25, 50 questions).
Add Half-Points If Needed
If you give partial credit, use a chart that includes half points like:
- 18.5 / 20
- 17.5 / 20
This makes grading more fair.
Keep It Visible
Print your chart or keep it open on your device while grading.
Match It with Your System
Make sure your chart matches your grading scale (A, B, C or GPA).
Common Mistakes to Avoid
Even simple tools can go wrong if used carelessly.
Using the Wrong Total
Always match the chart with the correct number of questions.
Ignoring Bonus Points
If bonus marks exist, add them before checking the chart.
Mixing Different Scales
Don’t confuse percentage with GPA or letter grades.
When Should You Use a Grading Chart?
A grading chart works best for:
- Multiple-choice tests
- Quick quizzes
- Class assessments
- Homework checking
- Standardized test prep
Basically, anytime you want fast and accurate grading
Grading Chart vs Manual Calculation
| Method | Speed | Accuracy | Effort |
|---|---|---|---|
| Manual Grading | Slow | Medium | High |
| Grading Chart | Fast | High | Low |
Clear winner: Grading chart
FAQs
1. Can I use a grading chart for any subject?
Yes, grading charts work for all subjects, especially for tests with fixed answers like math, science, or quizzes.
2. How do I create my own grading chart?
You can create one using a simple table. Divide correct answers by total questions and convert them into percentages.
3. Can grading charts include half points?
Yes, many charts support half-points. This is useful when giving partial credit for answers.
4. Are grading charts accurate?
Yes, they are very accurate if used correctly. Just make sure you’re using the right total number of questions.
5. Is a grading chart better than a calculator?
For repeated grading, yes. A grading chart is faster and reduces the chance of repeated calculation errors.
Final Thoughts
Using a grading chart the smart way can make your life much easier.
It saves time, avoids mistakes, and keeps everything fair for students.
You don’t need complex tools or software — just a simple chart and a clear system.
Start using one today, and you’ll never want to go back to manual grading again.